

Key Takeaways
New Home Construction
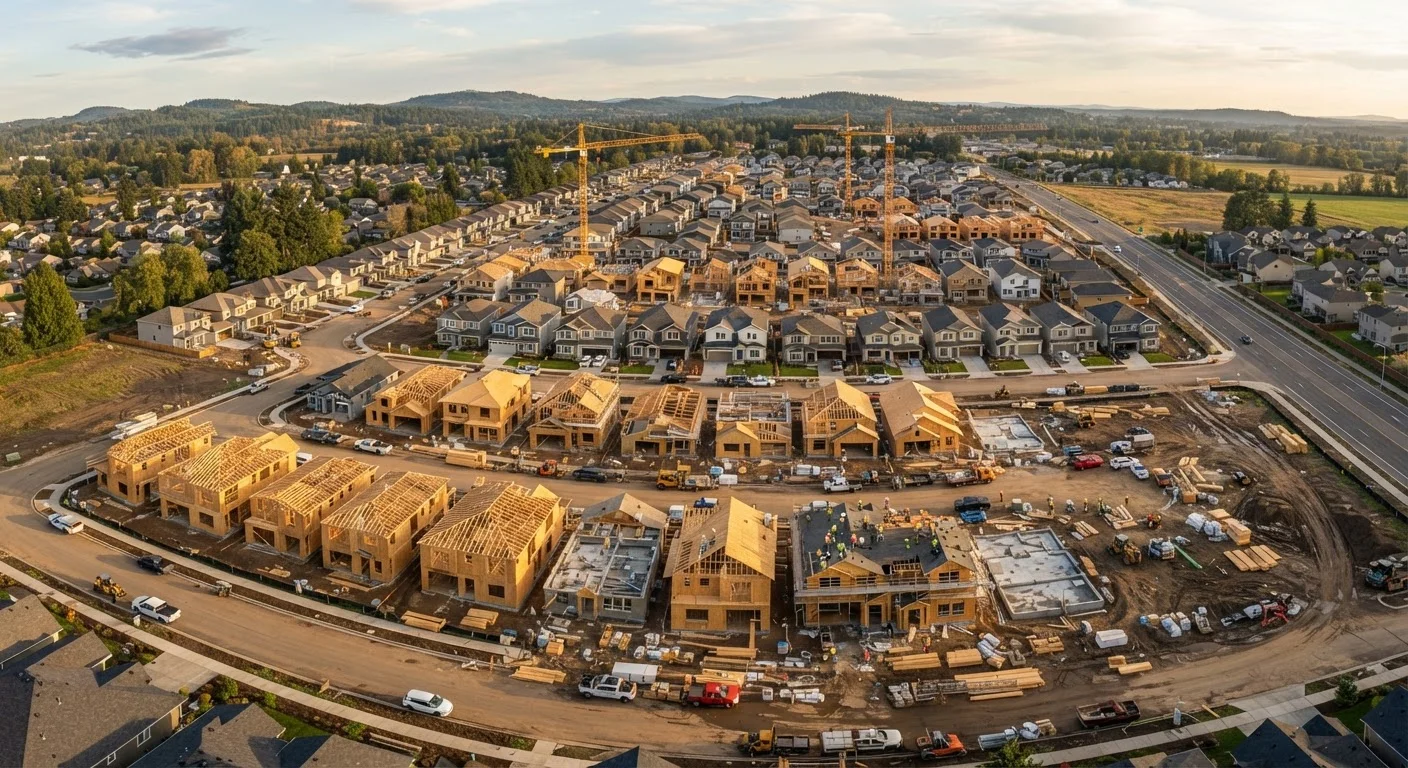
New home construction refers to the building of residential properties from the ground up, as opposed to the resale of existing homes. It adds fresh supply to the housing market and plays a central role in balancing the number of homes available against the number of people looking to buy or rent. When builder activity rises, it can ease price pressure; when it stalls, supply tightens and competition increases.
Economists and real estate analysts track new construction through housing starts (when ground breaks), building permits (regulatory approvals), and housing completions - each measuring a different stage of the supply pipeline.
The Role of New Construction in Housing Supply
Housing markets run on supply and demand. When demand outpaces supply - more buyers than homes available - prices rise. New construction is the primary mechanism by which supply grows over time, since the existing stock of homes only changes through demolition or conversion, not addition.
This is why builder activity carries so much weight in market analysis. A healthy pipeline of new homes keeps competition from getting out of hand; a prolonged slowdown in building contributes to the kind of inventory squeeze that pushes prices higher even when buyer demand softens.
New construction also matters structurally. Much of the U.S. housing stock is decades old, and population growth - driven by household formation, migration, and urbanization - continually creates demand for additional units. Without sustained building activity, the gap between need and availability widens.
1.4M+
U.S. housing starts in a typical year
According to the U.S. Census Bureau, annual single- and multi-family housing starts generally range between 1.2 and 1.6 million units in recent years.
3-6 months
Typical lag from permit to completion
The U.S. Census Bureau reports that the median time from permit authorization to completion for single-family homes is generally in this range, though it varies by region and project complexity.
~$100K
Median new-home price premium over existing homes
Historically, newly built homes have commanded a significant premium over comparable existing homes, reflecting current construction costs and developer margins - a gap that has widened in recent years.
Reading the Construction Pipeline: Permits, Starts, and Completions
Analysts track new construction through three sequential data points, each telling a different part of the story:
- Building permits are issued by local governments before work begins. They represent builder intent and regulatory approval - making them the earliest signal of future supply. A rise in permit filings today typically means more homes entering the market several months from now.
- Housing starts are recorded when ground is broken on a new unit. This is when construction spending, materials orders, and labor demand all kick in - giving starts economic significance beyond just real estate.
- Completions mark when a unit is finished and ready for occupancy. This is the point at which new supply actually reaches buyers or renters.
Tracking all three helps avoid misreading the market. A spike in permits doesn't instantly relieve a shortage - it only signals relief may be coming. Understanding that lag is important for anyone trying to make sense of economic signals that precede housing market shifts.
What Drives - and Limits - Builder Activity
Builders respond to market incentives, but a range of factors can accelerate or constrain their output regardless of demand.
Cost pressures
Construction costs - lumber, concrete, labor, and land - feed directly into the price of new homes. When material costs surge, as they did during pandemic-related supply chain disruptions, builders face a choice between absorbing losses or raising prices. Many do both partially, which is one reason newly built homes tend to carry a price premium. These dynamics also interact with mortgage interest rates, since financing costs affect both builder economics and buyer affordability simultaneously.
Zoning and regulatory constraints
Local zoning laws dictate where and what can be built. In many desirable markets, restrictive zoning limits higher-density construction - preventing the kind of infill development that would add supply where demand is highest. Permitting delays compound the problem: even when a builder is ready and willing, bureaucratic timelines can add months to a project. Understanding when permits are required is relevant even at the individual renovation level.
Where to Find Local Construction Data
The U.S. Census Bureau publishes monthly building permit and housing start data broken down by metropolitan area. Your local planning or building department is also a direct source for community-level permit filings. These resources can help you gauge whether supply is growing - or stalling - in your market.
Market conditions and builder confidence
Builders won't start a project they don't expect to sell. When interest rates rise sharply or economic uncertainty grows, builder confidence tends to fall - leading to fewer starts even if demand exists. This procyclical tendency can amplify housing market imbalances over time.
Why Local Context Matters More Than National Trends
National construction data offers a useful macro view, but it can obscure what's actually happening in any given community. A metro area experiencing a construction boom may see price moderation while a nearby region with restrictive zoning and few new permits remains undersupplied and expensive.
This is why local housing market data almost always tells a more actionable story than national averages. For buyers, renters, or anyone trying to understand what's shaping prices in their area, local permit data, builder activity reports, and community planning documents are far more relevant than headline figures.
New construction ultimately reflects the intersection of economics, policy, and geography - forces that play out very differently from one zip code to the next. Understanding how the building pipeline works gives you a clearer lens for interpreting the market around you, whether you're navigating the home purchase process or simply tracking how your neighborhood is evolving.
For a broader look at the forces that shape what homes cost, see our explainer on what actually drives home prices up or down.