

Key Takeaways
Our Verdict
The 2008 housing crash was the product of a specific, compounding set of structural failures - loose underwriting, exotic mortgage products, and systemic fraud in loan securitization - that are not automatically present in every market correction. Comparing today's conditions to 2008 without examining those root causes risks misreading the current landscape entirely. Informed readers are better served by evaluating the actual mechanics of each market period on its own terms.
| Best for | Recommended |
|---|---|
| Readers trying to assess current market risk | Focus on current lending standards and inventory data |
| Buyers unsure whether to act now or wait | Consult local market data rather than national headlines |
| Homeowners worried about a repeat crash | Examine your own loan structure and equity position |
What Actually Caused the 2008 Collapse
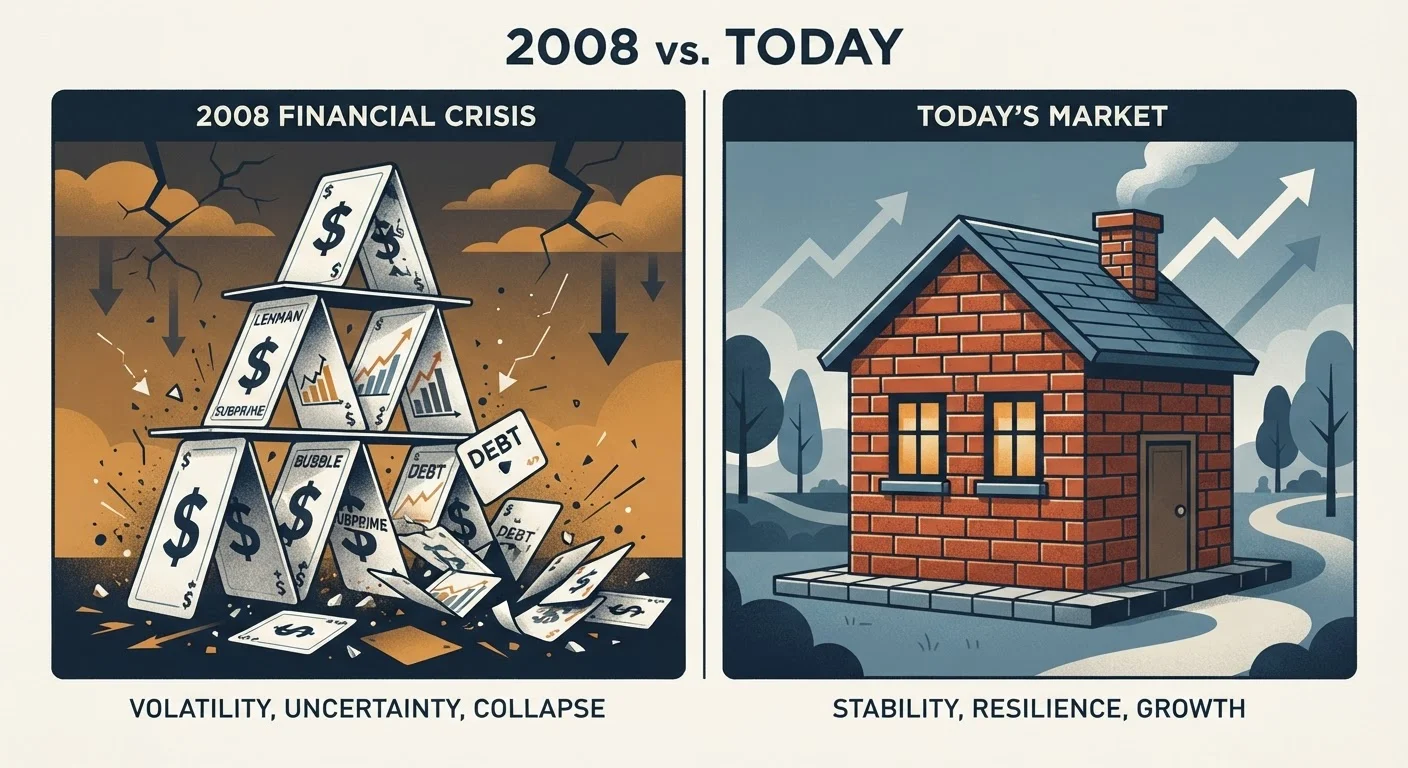
The 2008 housing crash is often described as a simple case of prices going too high and then falling. That framing omits the machinery that made it catastrophic. At its core, the collapse was driven by a breakdown in lending standards, the mass production of mortgage-backed securities that obscured underlying risk, and widespread issuance of loans to borrowers who could not realistically repay them under normal conditions.
Adjustable-rate mortgages with teaser rates, no-documentation loans, and piggyback financing allowed millions of buyers to purchase homes with little or no verified income and minimal down payments. When rates reset and values softened, those borrowers had no equity buffer and no path to refinancing. The result was a foreclosure wave that overwhelmed the market.
That sequence - lax origination, opaque securitization, mass default - is what distinguished 2008 from a standard cyclical correction. Without those specific conditions, a price decline, however significant, does not automatically replicate the same outcome.
How Today's Lending Environment Differs
Following the financial crisis, federal regulators introduced the Ability-to-Repay rule and the Qualified Mortgage (QM) framework under the Dodd-Frank Act. These rules require lenders to verify a borrower's income, assets, employment, and debt obligations before issuing a loan. The exotic products that proliferated before 2008 - option ARMs, stated-income loans, negative amortization mortgages - largely disappeared from the mainstream market.
Mortgage delinquency rates and the share of loans with low credit scores or high debt-to-income ratios are tracked closely by federal agencies and released publicly. When analysts evaluate the health of today's mortgage market, those metrics provide a more grounded baseline than surface-level price comparisons to prior decades.
Check the Underlying Loan Data
Federal agencies including the Consumer Financial Protection Bureau and the Federal Reserve publish regular data on mortgage origination quality, delinquency rates, and loan product composition. Reviewing these sources gives you a factual baseline that goes well beyond price charts. When assessing market risk, loan quality metrics are often more informative than headline price movements alone.
This doesn't mean today's market is risk-free. Affordability pressures, interest rate sensitivity, and regional imbalances are real concerns. But the specific failure modes of 2008 are not automatically present just because prices have risen or begun to soften. As noted in our guide on common housing market misconceptions, conflating a slowdown with a crash is one of the most frequent analytical errors readers encounter.
Supply Conditions Then vs. Now
Before 2008, homebuilders were producing at historically elevated rates, and speculative buying further inflated the apparent demand signal. When sentiment shifted, the market faced both excess supply and evaporating buyer interest simultaneously. That combination accelerated the price correction.
Post-pandemic housing market conditions have generally been characterized by the opposite dynamic: years of underbuilding relative to household formation, regulatory barriers to new construction in many metro areas, and homeowners with low locked-in mortgage rates choosing not to sell. These supply constraints have supported prices in ways that differ structurally from the pre-2008 environment.
| 2008 Housing Crash | Typical Cyclical Correction | Post-2020 Market Stress | |
|---|---|---|---|
| Primary driver | Lending failure & securitization fraud | Demand slowdown, economic cycle | Affordability strain, rate increases |
| Lending standards | Extremely loose, minimal verification | Varies; generally standard | Tighter post-Dodd-Frank rules |
| Borrower equity at risk | Near-zero for many borrowers | Modest; some equity present | Many owners hold significant equity |
| Supply conditions | Overbuilt; speculative inventory | Varies by region | Persistent undersupply in many metros |
| Foreclosure risk profile | Systemic; mass default wave | Isolated; localized stress | Low historically; watch rate resets |
| Recovery mechanism needed | Structural regulatory overhaul | Demand and rate normalization | Supply expansion, affordability programs |
None of this guarantees future price stability. It means the supply-side context is different enough that applying a 2008 template distorts rather than clarifies the picture. For a more grounded read, local market data often tells a more accurate story than broad national comparisons.
Why the Comparison Persists - and What to Do Instead
The 2008 crash was traumatic enough to become the default mental model for housing risk. That's understandable, but it can lead to two opposing errors: dismissing legitimate concerns by saying "this isn't 2008," or treating every market stress as a precursor to another collapse. Neither response is particularly useful without examining the underlying data.
A more disciplined approach involves asking what specific conditions are driving today's market - credit quality, inventory levels, employment trends, rate sensitivity - and evaluating each on its own terms. Our resource on evaluating housing market data before drawing conclusions offers a practical framework for this kind of analysis.
Similarly, before making any decision based on market comparisons, it helps to clarify what you actually need from the comparison - whether that's assessing purchase timing, understanding equity risk, or simply contextualizing news coverage. And when reading monthly reports and industry data, interpreting those sources critically can prevent misleading conclusions from taking hold.
This article is for general informational and educational purposes only and does not constitute financial, investment, or legal advice. Readers should consult a qualified professional before making real estate or financial decisions.