

Key Takeaways
Why Coverage Maps Exist - and What They're Designed to Communicate
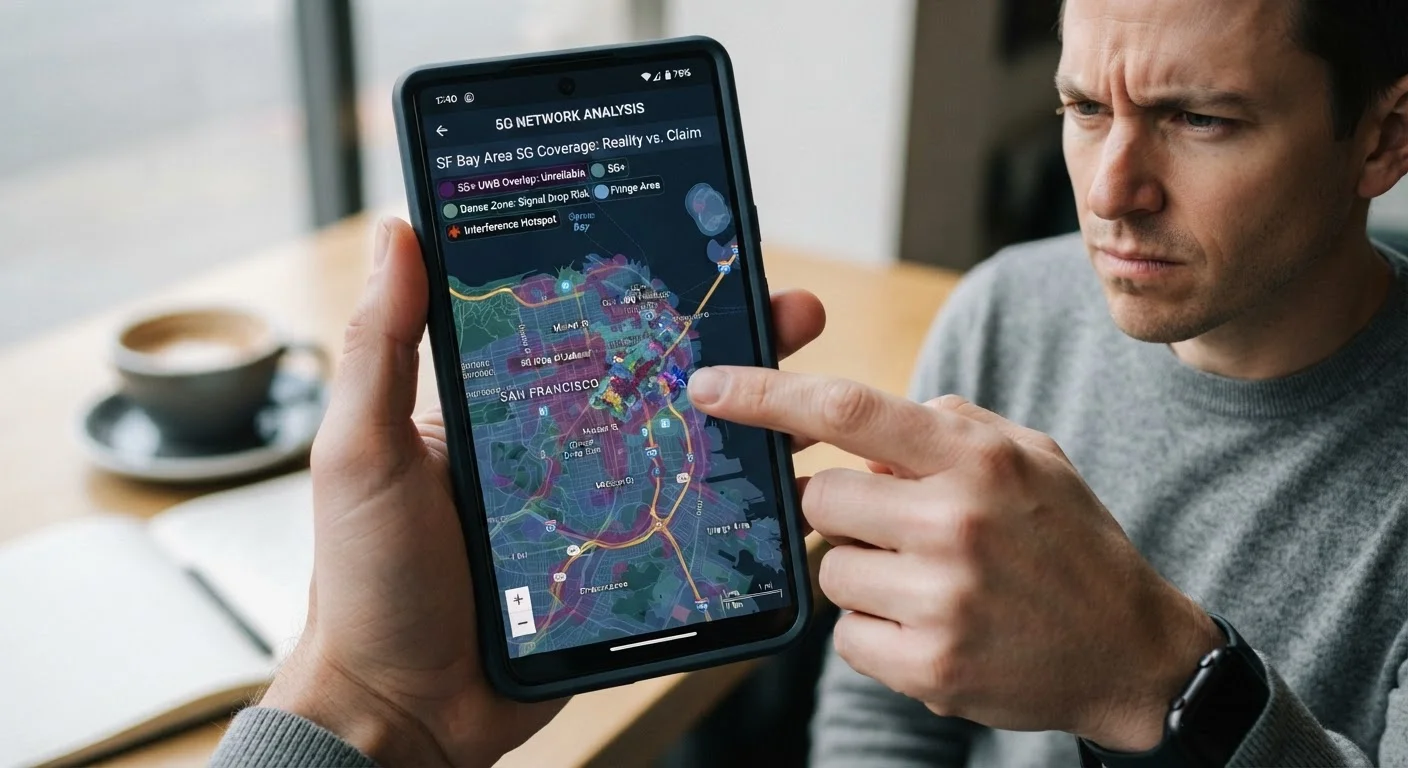
Every major U.S. carrier publishes an interactive coverage map that lights up vast swaths of the country in confident color. These maps serve a genuine purpose: they give prospective customers a rough geographic sense of where a carrier's network reaches. But they are built from predictive propagation models - mathematical estimates of where radio signals should travel based on tower locations, transmit power, and terrain data. They are not measurements of actual signal experienced by real users in real buildings.
Understanding that distinction is the first step to reading any coverage map critically. Before switching carriers or signing a contract, it helps to review this pre-contract checklist to go beyond the map.
Myth
If my address falls inside a carrier's colored coverage zone, I'll get 5G service there.
Fact
Coverage zones reflect modeled signal reach, not a guarantee of usable 5G at any specific indoor or outdoor location.
Propagation models use tower placement, transmit power, and terrain data to estimate where signal travels. They cannot account for your specific building's construction materials, the floor you're on, or whether a new structure has been built nearby. An address inside a coverage polygon may still experience weak or unusable signal indoors - particularly with higher-frequency 5G bands.
Myth
5G coverage is the same no matter which shade or label the map uses.
Fact
A single "5G" label can represent low-band, mid-band, or millimeter-wave service - technologies with entirely different speed and range characteristics.
Low-band 5G blankets wide areas but often delivers speeds only marginally better than 4G LTE. Mid-band 5G provides the faster, more consistent experience most 5G advertising implies. Millimeter-wave is limited to dense, short-range deployments like stadiums or busy street corners. Without filtering by band on the map, you cannot tell which technology covers your area.
Myth
A larger coverage footprint means better network quality.
Fact
Network quality depends on capacity, spectrum depth, and infrastructure density - none of which map area alone measures.
A carrier can achieve a broad geographic footprint by deploying low-band spectrum across rural areas while offering comparatively thinner mid-band capacity in suburbs. A competitor with a smaller total coverage zone might deliver faster, more consistent speeds where you actually live and work. Map size is a marketing metric; throughput and reliability under load are performance metrics.
Myth
Once you're in a 5G zone, your speed stays consistent throughout the day.
Fact
Network speeds fluctuate significantly with congestion, and coverage maps do not reflect time-of-day or load variations.
Each cell tower has a finite amount of bandwidth shared among all connected devices. During peak usage hours - morning commutes, lunch breaks, large events - individual users receive a smaller slice of available capacity. This is separate from, and additional to, carrier deprioritization policies that may reduce speeds further for certain data tiers once thresholds are crossed.
Myth
My 5G phone will automatically use the fastest 5G band available in a covered area.
Fact
Your phone can only access the 5G bands its hardware supports, regardless of what the carrier deploys nearby.
5G band compatibility varies significantly across phone models and even across variants of the same model sold by different carriers. A phone released for one carrier's network may lack the radio hardware required for another carrier's mid-band or millimeter-wave frequencies. Before assuming you'll receive a specific tier of 5G service, it's worth verifying your device's supported band list against the carrier's deployed spectrum in your area.
The 5G Label Hides Three Very Different Technologies
One of the most consequential things a coverage map leaves out is spectrum band detail. When a carrier shades an area as "5G covered," that label can represent low-band 5G (600-900 MHz), mid-band 5G (around 2.5-3.7 GHz), or millimeter-wave 5G (above 24 GHz). These bands have dramatically different speed and range profiles.
- Low-band 5G travels far and penetrates buildings well, but peak speeds are often only modestly faster than 4G LTE - sometimes indistinguishable in practice.
- Mid-band 5G offers a meaningful balance of range and speed, capable of delivering the multi-hundred-megabit performance many consumers expect from 5G marketing.
- Millimeter-wave 5G delivers the fastest theoretical speeds but covers extremely short distances and struggles with any physical obstruction - a single pane of glass can degrade it.
Most map interfaces don't default to showing which band is active in any given zone. You may need to toggle filters or read fine print to uncover whether an area is lit up by low-band or mid-band coverage. For a plain-language breakdown of terms like "deprioritization" and "spectrum bands," see the mobile plan terms glossary.
3
Distinct 5G spectrum bands with different performance profiles
Low-band, mid-band, and millimeter-wave 5G each offer different speed and range trade-offs, yet all appear under the same '5G' label on most carrier maps.
~20 dB
Typical indoor signal loss through standard building materials
Radio frequency engineers commonly measure 15-25 dB of penetration loss through concrete and brick walls, a factor predictive coverage models may underestimate.
< 1,000 ft
Practical range of millimeter-wave 5G in typical conditions
Millimeter-wave deployments, while capable of multi-gigabit peak speeds, are generally limited to short-range dense urban or indoor hotspot scenarios.
What the Map Can't Show You
Even a technically accurate propagation model omits several real-world factors that shape your daily experience:
- Building penetration loss
- Higher-frequency signals attenuate sharply through concrete, brick, and low-emissivity window glass. Indoor coverage in dense urban buildings can be substantially weaker than the map implies.
- Network congestion
- A tower that serves thousands of users during a commute hour will deliver slower speeds per device than the map's signal-strength estimate suggests. Coverage maps show signal presence, not available bandwidth.
- Terrain and foliage
- Hills, valleys, and dense tree canopy all cause signal shadowing that predictive models approximate imperfectly, especially in rural or mountainous regions.
- Your specific device
- Not every 5G phone supports every 5G band. A phone that lacks a mid-band radio will receive only low-band service in a mid-band coverage zone.
Carriers structure their networks differently, which affects where each of these gaps appears. How the major U.S. carriers structure their networks explains those trade-offs in practical terms.
Device Band Compatibility Can Override Coverage
Purchasing a phone unlocked or from a different carrier may mean it lacks the radio hardware for the 5G bands your carrier actually uses in your area. Before assuming you'll experience mid-band or millimeter-wave 5G, check the device's full band specification list - not just whether it carries a '5G' label. This is especially relevant when bringing your own device to a new carrier.
How to Supplement a Map Before You Commit
Coverage maps are a useful starting point, not a conclusion. Several approaches provide more grounded information:
- Use crowd-sourced speed data. Tools that aggregate real user measurements - collected by independent organizations - reflect actual network performance rather than modeled estimates.
- Request a trial period. Many carriers offer short return windows. Testing service at your home, workplace, and frequent commute route during that window is the most reliable signal check available.
- Ask neighbors and coworkers. Anecdotal evidence from people on the same carrier in your exact building or neighborhood cuts through map generalizations quickly.
- Check your device's band compatibility. Confirm your phone's supported 5G bands match what the carrier actually deploys in your area, not just what the map labels as covered.
The same critical evaluation applies when assessing home internet coverage claims. The questions worth asking before choosing any plan are explored in this guide to evaluating home internet plans.