

Key Takeaways
Why 'Original' Prices Are Often Not What They Seem
When a retailer displays a price as $120 $79, the implicit message is that you are saving $41. But that math only holds if $120 was ever a genuine, sustained price. In practice, many 'original' prices are set high specifically to make a subsequent markdown look impressive - a tactic known as reference price manipulation or, more colloquially, a phantom discount. Anchoring, strikethroughs, and phantom discounts are well-documented psychological pricing strategies retailers use to shape how shoppers perceive value.
Price history tools cut through this by showing you what a product actually sold for over an extended period - not just what the retailer claims it sold for. Even a few weeks of historical data can reveal whether the 'original' price existed in any meaningful sense.
Advertised Discounts Are Not Always Real
Retailers are legally permitted in most U.S. states to set a high 'original' price briefly before marking it down, making a modest reduction look like a steep discount. The FTC's guidelines on pricing require that a 'former price' be offered in good faith for a genuine period, but enforcement is inconsistent. Never rely solely on the retailer's stated 'was' price. Learn more about the legal gray area behind 'was/now' pricing.
What You Need Before You Start
Using a price history tool requires minimal setup, but a few basics will make your research faster and more accurate.
What you will need
Browser-based price tracker extension
Automatically overlays price history charts on retailer product pages as you browse.
Standalone price history website
Allows you to search a product by name or URL to view its full price timeline and set price-drop alerts.
Spreadsheet or notes app
Helps you manually record price observations across multiple retailers for side-by-side comparison.
How to Use Price History Tools Step by Step
Follow these steps whenever you encounter a sale price you want to verify. The process takes between five and fifteen minutes and can prevent a purchase decision based on manufactured urgency.
Identify the exact product listing you want to evaluate
Start with the specific retailer page for the item - not a search results page. Price history is tied to individual product listings, so variations in color, size, or seller can produce entirely different charts. Copy the product URL; you'll need it for standalone tracker sites.
Install a browser extension that surfaces price history
Several browser extensions pull historical pricing data and display it directly on retailer product pages. Look for extensions with a clear privacy policy that describe what data they collect. Once installed, revisit the product page - the extension typically displays a chart beneath or alongside the listed price automatically.
Read the price history chart
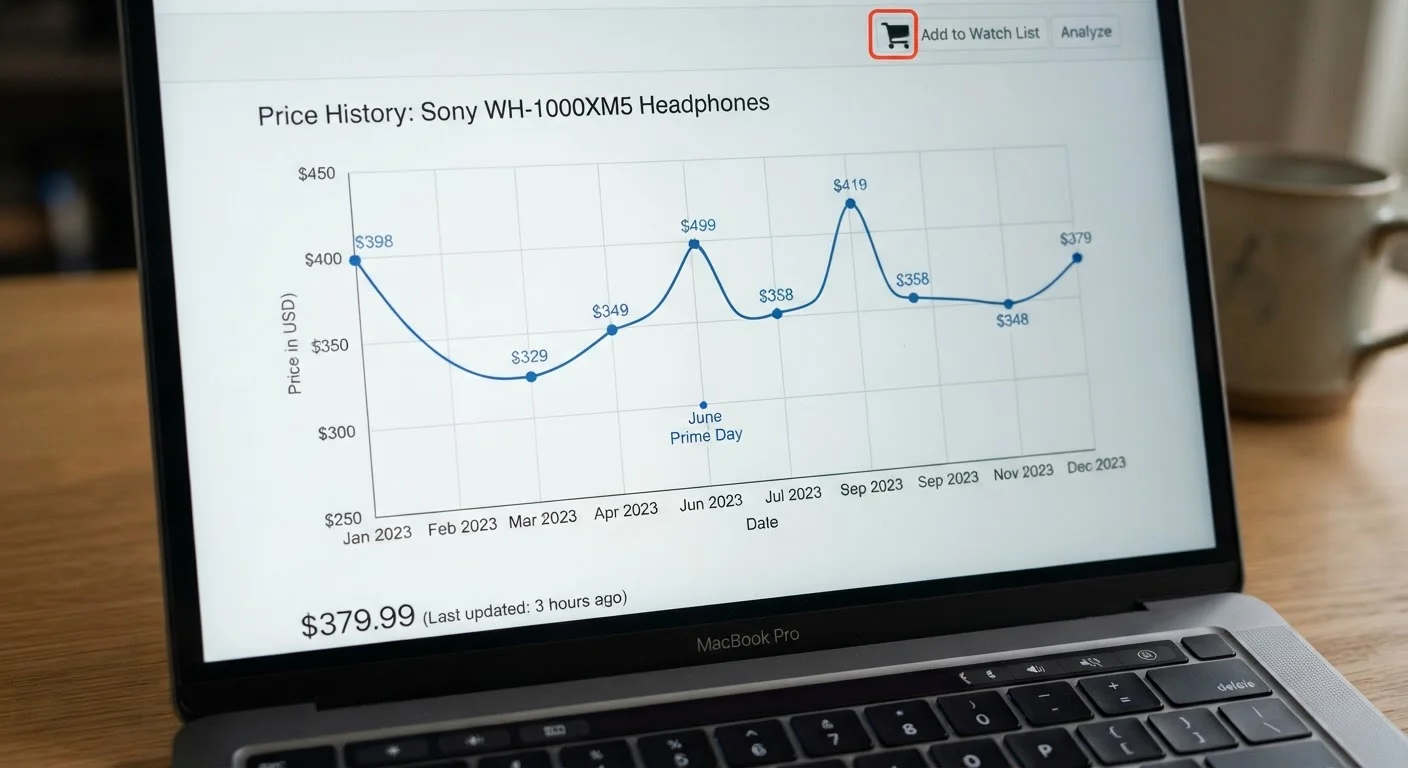
A standard price history chart shows price on the vertical axis and time (often 90 days to two years) on the horizontal axis. Look for three key signals:
- Flat lines punctuated by spikes: If the price was steady at a lower level and spiked upward shortly before a 'sale,' the spike created the inflated 'original' price.
- Recurring seasonal patterns: Regular price bumps around major shopping events followed by drops indicate predictable markdown cycles, not genuine savings.
- Gradual decline: A price that has been falling steadily may fall further - waiting can pay off.
Compare the current price to the historical average
Many tracker tools display a 90-day or 180-day average price alongside the current price. This average is a more honest baseline than the retailer's listed 'was' price. If the current price is above the historical average, you are not getting a deal regardless of what the sale badge says. If it is at or below the average, the offer deserves closer attention.
Cross-reference with a standalone tracker site
Paste the product URL into a dedicated price history website for a second data source. Different trackers pull data at different intervals and from different sources, so discrepancies between them are normal. Where both sources agree that the current price is near or below the historical average, you have stronger evidence of a genuine low. Where they disagree significantly, treat the data with caution and allow more time before purchasing.
Factor in seasonal timing before deciding
Price history charts often make seasonal cycles obvious. Electronics tend to dip after the winter holidays; outdoor and patio goods drop after summer; apparel goes on clearance at the end of each season. If the chart shows the product reliably hits a lower price at a predictable time of year and you are not in that window, waiting may result in a better price. Seasonal discounting patterns can help you calibrate timing by product category.
Check the 90-Day Average, Not Just the Low
The all-time low price can be misleading if it occurred once during a flash sale years ago. The 90-day or 180-day average gives a more realistic baseline for what the product typically costs. If the current price is at or below that average, the offer is worth serious consideration.
Putting the Data in Context
A price history chart answers one question well: Is this price low relative to recent history? It does not answer every relevant question about a purchase. Cost of ownership, product quality, and return policies all matter independently. For a broader view of what makes a discount meaningful, consider what real discounts actually look like beyond the percentage-off figure. And if your evaluation involves comparing unit sizes or long-term costs, price-per-unit and total cost of ownership metrics provide a fuller financial picture.
Price History Data Has Limitations
Third-party price trackers rely on data they can access, which may not capture every price change or seller variant. Data gaps, seller switches, or bundled pricing can skew charts. Use price history as one signal among several, not as a definitive guarantee of the lowest possible price.
Used consistently, price history tools shift the information balance. Retailers have always known the full price trajectory of their products; now consumers can access much of the same data. The result is not a guarantee of always paying the lowest price, but a meaningful check on pricing claims that would otherwise go unverified.